
Nachricht
Key Performance Indicators (KPIs) for Software Development: Essential Metrics to Track
When a team is building an app or a program, everyone wants to know if things are going okay. KPIs are just simple numbers that help see the real situation. They show how quickly new features get done, how often things break, and whether the team is actually moving forward or just spinning wheels.
Good KPIs let the team notice problems early – before users start complaining. They also give managers a clear picture of whether the team is on track or needs to change something in the way they work.
Why Even Bother With KPIs in Development
Without any numbers it’s hard to understand what’s really happening. Building software takes many steps: someone writes code, someone checks it, someone fixes bugs, then everything goes live to users. If something gets stuck somewhere, you usually notice too late.
KPIs give a clear view of:
- How long a new feature takes from start to users
- How many bugs appear after each update
- Whether the team finishes what they planned
- How much time is wasted on waiting instead of actual work
When people look at these numbers regularly, it becomes easier to fix things. For example, if code sits for days waiting for review, the team can start making smaller changes or add automatic checks.

Main Groups of KPIs People Actually Use
All KPIs usually fall into a few simple groups. Most teams don’t try to track everything – they choose 4–7 numbers that really matter for their project. Below are the four main groups that appear in almost every mature development team.
Speed of Delivery
This group answers one basic question: how fast does new functionality actually reach real users?
The faster a team can get code from idea to production, the quicker they can get feedback, fix issues, and respond to what customers really need. Slow delivery usually means big batches of changes, long approval chains, or complicated deployment processes.
Key metrics in this group include:
- How often the team releases updates (Deployment Frequency)
- How long it takes from the first line of code to live users (Lead Time for Changes)
Teams that release small updates several times a week or even every day usually have much less risk when something goes wrong.
Quality and Stability
This group looks at how safe and reliable the product stays after changes are made.
Even very fast teams can destroy trust if every update breaks something important. Quality metrics help understand whether speed comes at the cost of stability.
Workflow and Flow Inside the Team
This group shows what really happens between “we started the task” and “the task is done”.
Very often developers spend more time waiting than actually coding. This group reveals hidden delays: waiting for code review, waiting for tests to run, waiting for someone to unblock something.
Main indicators:
- What percentage of total time is active work vs waiting (Flow Efficiency)
- How tasks pile up in different stages over time (Cumulative Flow diagram)
- How long one typical task takes from start to finish (Cycle Time)
When these numbers improve, the whole process feels smoother and less stressful – even if the team doesn’t work harder.
Planning and Predictability
This group checks whether the team can make realistic promises and actually keep them.
Bad planning leads to constant scope creep, missed deadlines, burned-out people, and angry stakeholders. Good planning builds trust inside the team and with clients or management.
When velocity is stable and planning accuracy is high, it becomes much easier to say “this feature will be ready in three weeks” – and really mean it.
Most teams start with one or two metrics from each group and slowly add more only when they see clear value. Tracking too many at once usually creates noise instead of clarity. The best approach is to pick numbers that directly connect to the biggest current pain points of your project.
How We Approach KPIs at Mobian Studio
Bei Mobian Studio we don’t treat KPIs as just another dashboard item to fill. When we build dedicated teams for our clients – whether it’s augmenting an in-house group or delivering a full platform from scratch – we make sure the right metrics are in place from day one. We usually start with a small, focused set: DORA basics for delivery speed and stability, cycle time and flow efficiency to spot where real work gets stuck, plus code coverage and bug rate to keep quality honest. These numbers aren’t there to judge developers; they help everyone see clearly whether we’re moving fast without creating hidden debt or production headaches.
What we have learned from dozens of long-running partnerships is that good KPIs become even more powerful when the team actually owns them. We don’t impose arbitrary targets – instead, during onboarding we sit together with the client and map out which metrics matter most for their current stage: maybe tighter MTTR for a fintech product that can’t afford downtime, or lower rework rate when scaling a healthcare platform with strict compliance needs. We track trends over months, not days, and we use them in our regular syncs to decide where to add capacity, simplify workflows, or invest in better testing. In the end, the goal is always the same: build something reliable that grows smoothly, so our clients can focus on their business instead of firefighting code.
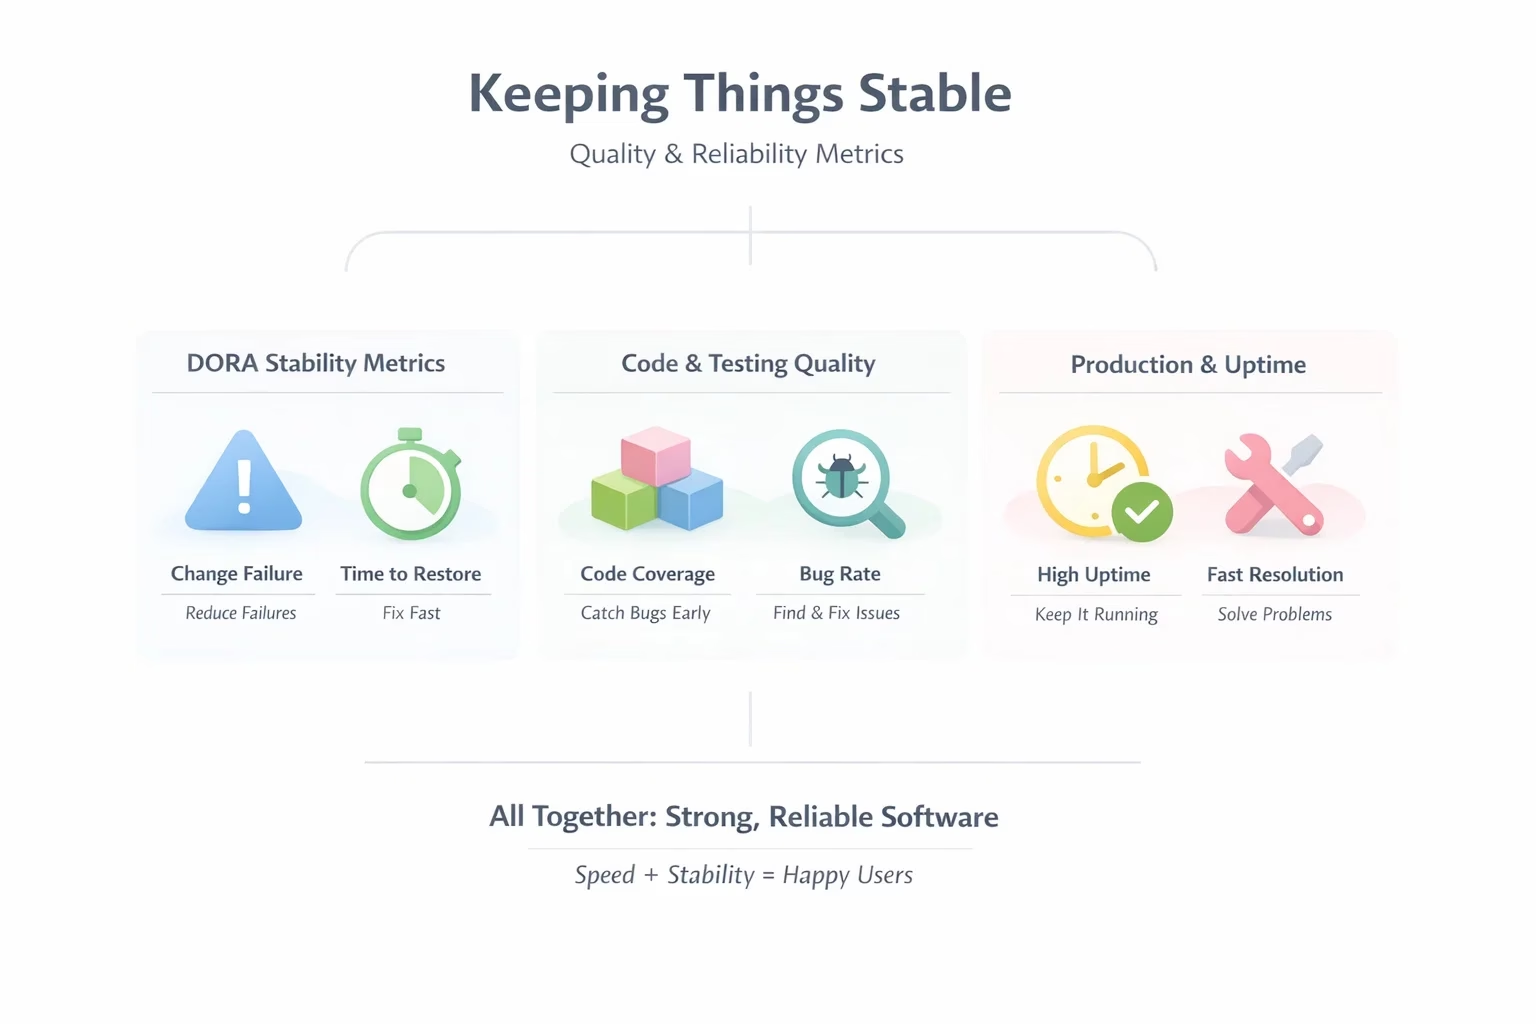
Keeping Things Stable: Quality, Bugs, and Reliability Metrics
This part is all about one clear goal: make sure the app or website doesn’t break all the time, and when something does go wrong, fix it fast. These numbers help teams ship new stuff without turning every update into a mess of crashes and angry users.
Lots of teams start with the well-known DORA metrics. They are popular because they show both how fast you deliver changes and how safely you do it. DORA splits things into two sides: speed of delivery and stability (how much things stay working). Here we focus on the stability side, plus a few other common quality checks.
DORA Stability Metrics
These two numbers show what happens once the code is live for real users. They help answer: “Are our changes safe, and can we recover quickly if something goes wrong?”
Change Failure Rate
This is the percentage of releases that cause real trouble – crashes, broken features, or forced rollbacks.
Lower is better – good teams keep it under 5–10%.
High numbers mean frequent releases are risky: lots of fixes, unhappy users, and wasted time putting out fires.
Time to Restore Service (MTTR)
This measures how long it takes to detect, fix, and bring the system back after a production issue.
Faster is better – hours instead of days.
Quick recovery limits damage, keeps users from leaving, and stops small problems from becoming big outages.
These two DORA numbers matter because they directly affect trust: few bad releases + fast fixes = a product people rely on. They balance speed with real reliability.
Code and Testing Quality Metrics
These metrics look at the code while you’re still building it – before anything goes live to users. They help catch problems early, so bugs don’t sneak out and cause trouble later.
Code Coverage
This shows what percentage of your code is actually run (executed) by automatic tests.
Hitting 100% doesn’t mean the code is perfect – bad tests can give false confidence. But higher coverage (especially on important parts) usually means fewer hidden bugs and nasty surprises after release.
Teams often focus on good coverage for the critical pieces rather than chasing a magic number everywhere.
Bug Rate (or Defect Density)
This counts how many bugs show up in a specific piece of code, module, or feature (for example, bugs per 1,000 lines or per story).
If one area of the app has way more bugs than others, that’s a clear warning sign. Common reasons include:
- Overly complicated code
- Weak or missing tests
- Unclear requirements from the start
Spotting high-bug zones early lets you refactor, add tests, or clarify things before users feel the pain.
Rework Rate
This measures how often code that was recently finished has to be changed or fixed again soon after (usually within a couple of weeks).
Lots of rework usually points to one of these:
- Rushed development
- Poor handoffs or communication between team members
- Weak early reviews or tests
- Requirements changing mid-task
Keeping rework low saves a huge amount of time and reduces frustration – the team spends less time undoing its own work and more time moving forward.
These three metrics work together to prevent bugs from being created in the first place. When code coverage is solid, bug rates stay low, and rework is minimal, far fewer problems make it to production – which means smoother releases and happier users.
Production Reliability and User-Facing Fixes
These two metrics show what users actually experience every single day – not just during big releases, but in normal, everyday use. They answer the question: “Does the app stay up when people need it, and do problems get solved quickly?”
Uptime
This is the percentage of time the system is available and working normally – no crashes, no slowdowns, no “sorry, we’re down” messages.
It’s usually measured as “nines”:
- 99.9% uptime = about 8.8 hours of downtime per year (three nines)
- 99.99% = less than 1 hour of downtime per year (four nines)
High uptime builds trust: users open the app, it just works, they keep coming back. Low uptime creates problems:
- Users get frustrated and leave (or switch to competitors)
- Business loses money (especially in e-commerce, banking, SaaS, or any service where downtime = lost revenue)
- Reputation takes a hit – bad reviews, social media complaints, lost customers
Good teams monitor uptime constantly with tools that alert them the second something drops below target.
Time to Resolution
This tracks how long it takes to fully fix bugs or issues that users (or monitoring systems) report – especially the important ones that affect real people.
It starts when the bug is reported (or detected) and ends when the fix is live and verified.
Faster resolution means:
- Users suffer less (a broken checkout doesn’t stay broken for days)
- The team looks responsive and caring
- Small issues don’t snowball into bigger outages
Slow resolution usually happens because:
- The team is overloaded with too many tickets
- Priorities are unclear (everything feels urgent)
- No single person owns the fix
- Fixes take forever to deploy (manual processes, long approvals)
These two metrics bring everything full circle: they connect the team’s internal work (code quality, releases, recovery speed) directly to the end-user feeling.
When uptime is high and fixes come quickly, users don’t notice problems – they just enjoy the product.
When either number suffers, no matter how fast you ship features, people will feel the pain and remember the bad experience more than the new button you added.
In short: great code quality and fast DORA numbers are important, but if uptime drops or bugs linger for weeks, users won’t care about anything else. These two keep the focus on real people using the product every day.
Why Put Them All in One Group
All these numbers are about the same thing: keeping the software strong and dependable.
- DORA stability looks at what happens right after release.
- Code and testing metrics prevent problems during building.
- Uptime and resolution show day-to-day health.
When you track a few from this group, you can clearly see if you’re getting faster without making the product less reliable.
If speed goes up but bugs, failures, or downtime get worse – that’s a sign to pause and strengthen the basics (better tests, smaller changes, clearer reviews).
Quick Tips for Using These Metrics
Don’t track everything at once – start with 2–4 that hurt your project the most right now.
A solid beginner set: Change Failure Rate + MTTR + Code Coverage + Uptime.
Watch how the numbers change over weeks or months, not just one bad week.
Good numbers here usually mean less emergency work, happier users, and a calmer team.
How to Choose and Use KPIs Without Going Crazy
Pick only a few that really matter for your project. Four to six is usually enough.
First measure where you are now (baseline), then set small realistic goals. Look at trends over weeks or months, not at single bad days. Balance speed numbers with quality numbers so you don’t burn out the team or create huge technical debt. Explain to everyone why these numbers matter. If people understand the point, they won’t try to cheat the metrics.
Schlussfolgerung
Good KPIs in software development are simple numbers that show real speed, quality, and whether work is stuck somewhere. DORA metrics give a strong base for delivery and stability. Add cycle time, velocity, flow efficiency, code coverage – and you already have a clear picture. The main thing is to track a small number of useful ones, look at them regularly, and use them to make small smart changes. That way the team delivers better software with less stress and fewer surprises.
Häufig gestellte Fragen
What are the main DORA metrics?
They are: how often you release, how long changes take to go live, how many releases break things, and how fast you fix breaks.
What’s the difference between cycle time and lead time?
Cycle time counts from when real work starts until the task is done. Lead time usually starts earlier – from idea, request or first commit – until it’s live.
Why shouldn’t you measure lines of code?
It pushes people to write more code instead of good code. It doesn’t show how hard the task was or how much value it brings.
What does velocity actually tell you?
It shows how much work (in story points) your team finishes in a sprint. It helps make realistic plans for the next ones.
How does flow efficiency help?
It shows how much time is wasted waiting instead of working. Fixing waiting spots usually speeds everything up.
Is high code coverage enough for good quality?
No. It shows what’s tested, but not whether tests are good or useful. Combine it with bug numbers and real user feedback.
Should you track 20 different KPIs?
No. Too many numbers create confusion. Start with 4–7 that connect directly to your biggest problems or goals.
Ready to stop rebuilding and start shipping?
Most of our engagements start with a single conversation about where your current team is stuck. No pitch deck, no obligations.


